After demonstrating something they learned in Google Sheets, during a course taken in the Applied Digital Skills - with Google class, a grade 9 student mentioned "you can only create charts in Microsoft Excel".

I asked the students to use the data they had on their spreadsheet and experiment/figure out how to create a chart in Google Sheets. After trial and error, i gave them some hints and eventually, we created a chart. We played around with a few scenarios where the chart would not have generated correctly. We edited the chart and added the missing information. One of the students used a Personal Computer, another used an iPad. We concluded that any spreadsheet app or software can create a chart.
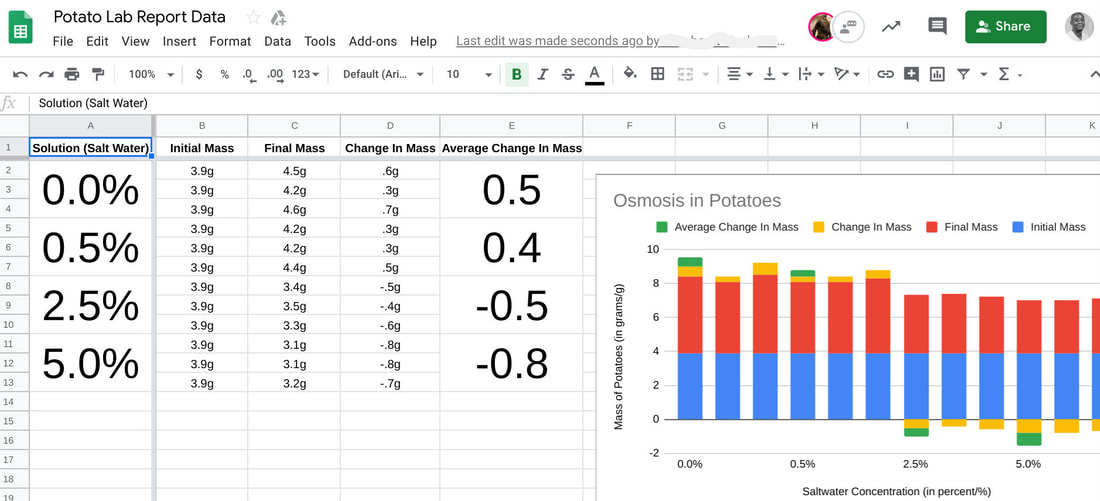
When the students walked into class the following day, they were so excited to tell me that soon after, they used they newly acquired skill to create a chart during a Biology class. One student was so eager to show me the chart they created. Below is a screenshot of the spreadsheet.
When the students walked into class the following day, they were so excited to tell me that soon after, they used they newly acquired skill to create a chart during a Biology class. One student was so eager to show me the chart they created. Below is a screenshot of the spreadsheet.

 RSS Feed
